
The average Exeter home sold for £284,188 in September, down 2.2% in a year. Private rents fell 0.2% to £1,317, the first annual fall since 2021.
The average Exeter home sold for £284,188 in September 2026. That is £6,368 less than a year earlier, a fall of 2.2%. Over the same year England rose 0.8%.
Private rents in the city have stopped rising as well. The average Exeter rent was £1,317 a month in October, 0.2% lower than a year before. It is the first time Exeter rents have fallen on the year since March 2021.
Both sets of figures were published on 18 November. House prices come from the UK House Price Index for Exeter, built from completed Land Registry sales. Rents come from the Office for National Statistics Price Index of Private Rents.
Overview
- Average house price, September: £284,188, down 2.2% in a year and 1.9% in a month
- Against England: £8,810 below the England average of £292,998
- In Devon: the joint biggest annual fall of the ten Devon, Plymouth and Torbay areas, level with Torridge
- Flats: £165,617, down 4.8% in a year
- Average rent, October: £1,317 a month, down 0.2% in a year, the first annual fall since March 2021
- Still the dearest rent in Devon: every other Devon district averages £1,022 or less
House prices: September gave back August’s rise
August had looked like a turn. The revised figure for that month is £289,583, up 1.8% on July. September took all of it back and more, falling £5,395 in a month.
The index sets January 2023 at 100. Exeter now reads 93.3. In cash, the average home is £20,308 below the £304,496 it reached in January 2023.
The UK House Price Index is a mean average, not a median, so a handful of large or small sales can move one month. The yearly change is the steadier guide, and it has been negative in every month since February 2026.
Every property type fell over the year:
| Type | Average price | Annual change |
|---|---|---|
| Detached | £520,194 | -2.0% |
| Semi-detached | £348,141 | -1.1% |
| Terraced | £284,408 | -1.7% |
| Flat or maisonette | £165,617 | -4.8% |
Flats are still falling fastest. Across England flats fell 3.3% and across Devon 2.7%, so Exeter’s flat market is weaker than both. England’s detached, semi-detached and terraced homes all rose over the year, by between 1.4% and 2.3%.
A first-time buyer in Exeter paid an average of £244,959, down 2.1%. That is now £93 below the England first-time buyer average of £245,052. Home movers paid an average of £342,298, down 2.2%.
Where Exeter sits in Devon
Exeter and Torridge both fell 2.2% over the year, the steepest falls in the county. Five areas rose.
| Area | Average price | Annual change |
|---|---|---|
| Plymouth | £218,938 | +2.1% |
| West Devon | £293,312 | +1.9% |
| East Devon | £349,234 | +1.6% |
| South Hams | £364,647 | +1.4% |
| Mid Devon | £287,056 | +0.1% |
| Teignbridge | £300,274 | -0.4% |
| Torbay | £222,766 | -1.3% |
| North Devon | £283,971 | -1.6% |
| Exeter | £284,188 | -2.2% |
| Torridge | £261,295 | -2.2% |
The average Exeter home is now cheaper than one in Mid Devon, West Devon or Teignbridge, and only £217 dearer than one in North Devon. Devon as a whole averaged £307,182, down 0.1%, and the South West £301,616, up 0.3%.
Rents: rising 6.5% a year ago, falling now
A year ago Exeter rents were rising 6.5% a year. The rate has slowed in every month since, and in October it dipped below zero.
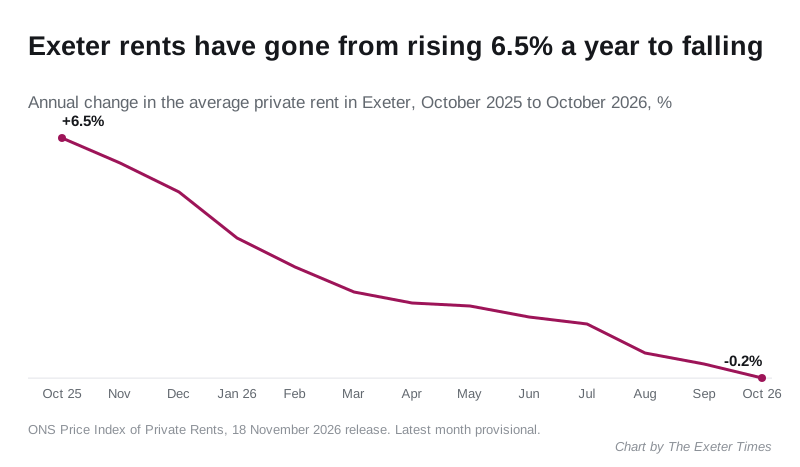
The fall is small, £2 a month on the average rent. What has changed is the direction. Across England rents rose 4.0% over the same year, to £1,472, and across the South West they rose 3.3%, to £1,254. Only 17 of the 334 local authority areas in the index recorded a fall.
By size of home, the October averages in Exeter were:
- one bedroom: £912, down 0.2%
- two bedrooms: £1,129, down 0.1%
- three bedrooms: £1,362, up 0.2%
- flats and maisonettes: £1,043, down 0.5%
Exeter is still by some way the most expensive place to rent in Devon. South Hams is next at £1,022, then Plymouth at £1,014 and East Devon at £982. North Devon was the only other Devon area where rents fell, also by 0.2%.
The ONS index covers rents that tenants actually pay, existing tenancies as well as new lets. Asking rents on property websites are usually higher. The latest month is provisional, and the ONS publishes the series as official statistics in development.
What it means for you
If you are selling. The average Exeter sale is worth about £6,400 less than a year ago, and flats about £8,400 less. Price to recent sales on your own street, which you can check free on the Land Registry price paid service.
If you are buying your first home. The typical Exeter first purchase, at £244,959, is well under the £300,000 threshold below which first-time buyers pay no stamp duty.
If you rent. The index says the market has stopped rising, not that rents are coming down. A landlord can still propose a rise at renewal. Rents in Exeter have been flat at between £1,312 and £1,323 for every month of the past year.
If you are a landlord. Rents have stalled while values have fallen 2.2%, and flats 4.8%. Gross yields on a flat have edged up as a result, but only because the price fell.
Earlier figures revised
Land Registry revises recent months as more sales are registered. The July figure we reported on 20 September, £282,696, now reads £284,519. June, first published at £280,982, now reads £282,484. We have added dated notes to the July article and the June article.
The figures for October 2026 are due on 16 December. Our Exeter house prices page carries the latest numbers.
Sources
- UK House Price Index, Exeter, September 2026, HM Land Registry, for the average price, index, property types, first-time buyers and movers, and the revised earlier months.
- The same index for England, Devon, the South West and each Devon district, Plymouth and Torbay, for the comparisons.
- Price Index of Private Rents, 18 November 2026 edition, Office for National Statistics, for the rents, Table 1.
Have your say