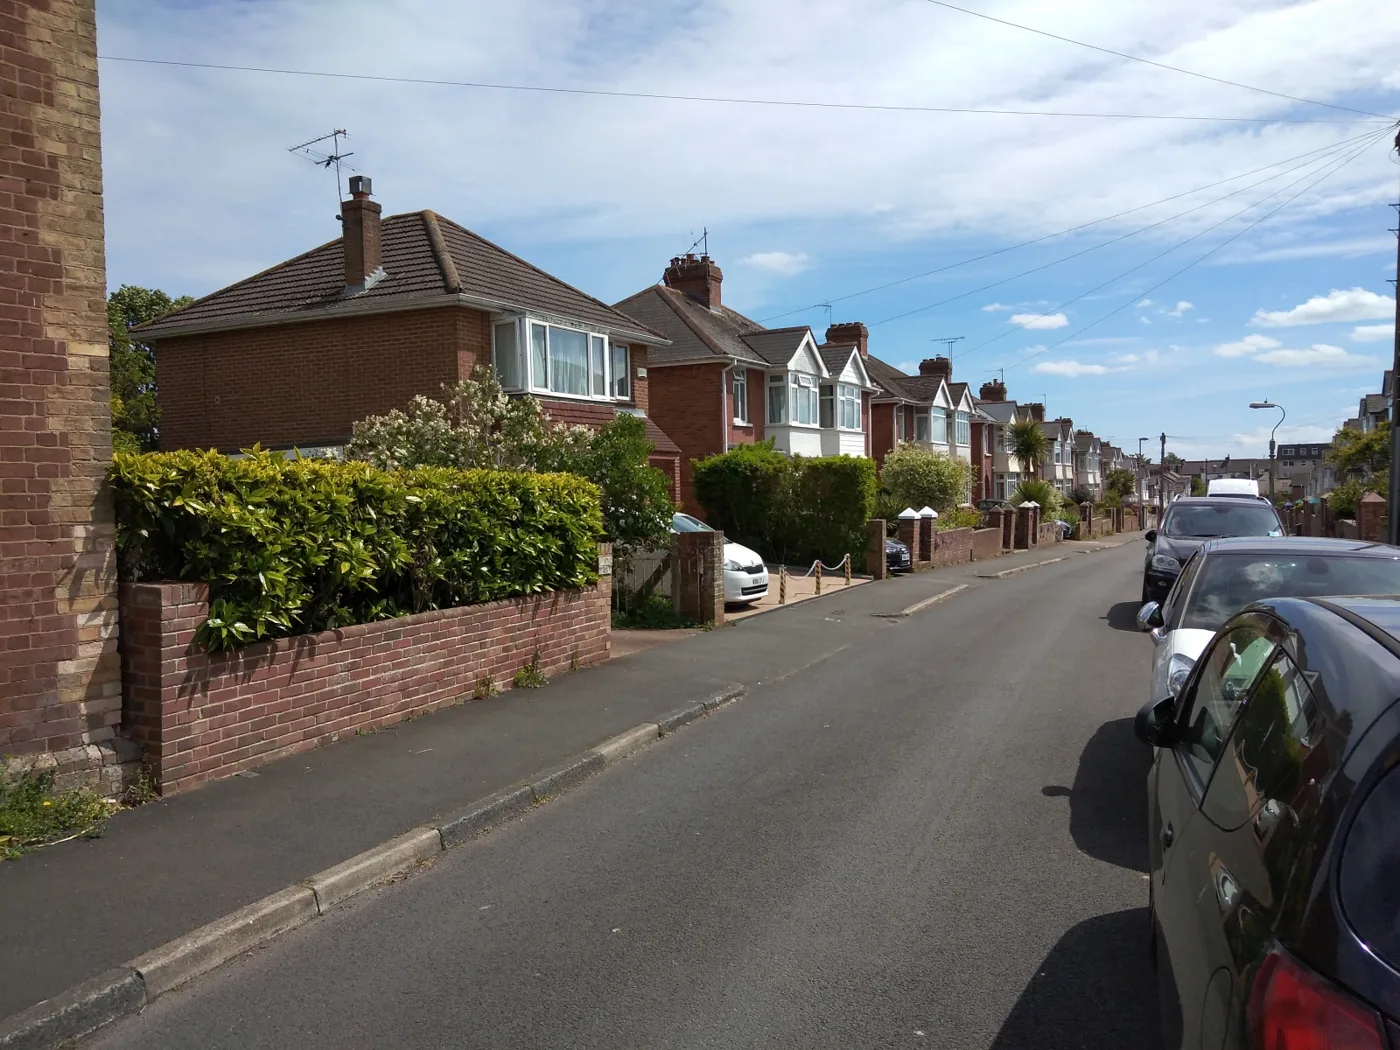

The average Exeter home sold for £280,982 in June, down £4,919 in a year and the lowest since May 2024. Only South Hams fell further across Devon.
The average Exeter home sold for £280,982 in June 2026, according to figures published this morning by HM Land Registry. That is £4,919 less than a year earlier, a fall of 1.7%, and the lowest monthly average the city has recorded since May 2024. (UK House Price Index, Exeter, June 2026)
Prices in England rose 1.8% over the same twelve months and the South West rose 1.9%. Exeter went the other way, and the gap now shows in cash: a typical English home costs £293,262, so an Exeter one is about £12,280 cheaper.
Only one Devon district fell further
The index covers every district in the county on the same day and the same basis, which makes the comparison a fair one. Across the ten Devon and Plymouth areas, Exeter’s annual change was the second worst. Only South Hams, down 6.8%, fell harder.
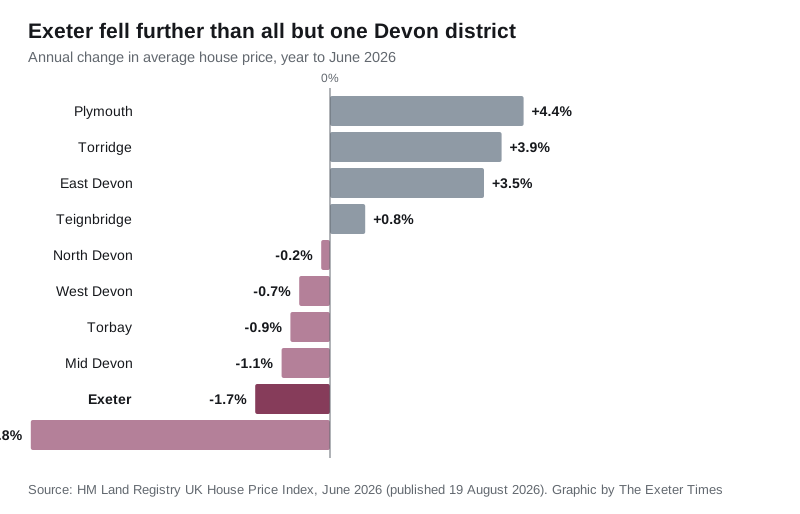
The split is geographic. The three areas rising fastest are the cheaper ones: Plymouth at £222,817, Torridge at £260,783 and East Devon at £345,757. The city sits between them at £280,982, below the Devon county average of £304,968 and below neighbouring Teignbridge at £303,564 and East Devon.
That is not the usual order. Exeter has the university, the hospital, the county council and the regional offices, and it is where the M5 stops. It normally prices above the county, not below it.
Flats are the weak point
The index also splits the city by property type. Every type fell over the year, but not by the same amount.
| Type | Average price | Annual change |
|---|---|---|
| Detached | £515,379 | -2.1% |
| Semi-detached | £343,252 | -1.0% |
| Terraced | £280,798 | -0.8% |
| Flat or maisonette | £164,582 | -4.0% |
| First-time buyer | £241,749 | -1.7% |
Flats fell furthest, and they have been falling longest. The index sets January 2023 at 100 for every area. Exeter flats now read 87.9, against 92.3 for detached homes, 93.7 for terraces and 93.9 for semis. In other words the city’s flats have lost about an eighth of their value in three and a half years, while houses have lost less than a tenth.
That matters here more than in most Devon towns. Exeter has a large purpose-built student and rental flat stock around the university, Sidwell Street and the quay, and the terraces of Newtown, St Thomas, Heavitree and Exwick are the shape of most of the rest.
Three and a half years of going backwards
The clearest way to read the Exeter number is against the January 2023 baseline rather than against last month. The city’s index now stands at 92.3, so the average price is 7.7% below where it was in January 2023. In cash, £304,496 then against £280,982 now, a drop of £23,514.
The city has not simply drifted down. It fell hard through 2023 and the first half of 2024, bottomed at £280,206 in May 2024, recovered to £295,592 by March 2025, and has been sliding again since. Every month of 2026 so far has been below the same month a year earlier apart from January, and the fall has run between 1.5% and 2.9%.
What it means for you
If you are buying. A flat is where the discount is. Exeter flats average £164,582, down 4.0% in a year and 12.1% below January 2023. The first-time buyer average is £241,749, itself down 1.7%. Set against a rising England, the city is getting relatively cheaper, not just absolutely.
If you are selling. The figure to hold in mind is that the market you are selling into is not the one from spring 2025. The average is £14,610 below March 2025’s £295,592. A price that felt reasonable eighteen months ago is above the market now.
If you are staying put. Nothing here changes what your home is worth to you, but it does affect the equity behind a remortgage. A 2023 valuation is likely to be optimistic.
Two warnings about the number itself. The index is a mean average, not a median, so a handful of large sales pull it about. And Exeter records a small number of completions each month: 84 in April 2026, 111 in March, 104 in February. On volumes that size, one month is a wobble rather than a trend.
The index also revises. Our own record of the May figure, taken on 16 August, read £281,197 and an annual fall of 2.2%. This morning’s release restates the same month as £283,122 and a fall of 1.5%, an upward revision of £1,925 to a figure that had already been published. Treat any single month, including this one, as provisional.
The next release, covering July 2026, is due on 16 September 2026.
Correction and update, 20 September 2026. HM Land Registry has revised the June figures since this article was published. Exeter’s June average, given here as £280,982 and an annual fall of 1.7%, now reads £280,643 and a fall of 1.8%. The national comparisons moved further: England’s June annual change, given here as 1.8%, now reads 1.2%, and the South West’s, given as 1.9%, now reads 1.4%. England’s June average, given here as £293,262, now reads £291,581, so the gap between a typical English home and a typical Exeter one in June was £10,938, not the £12,280 stated above. The July figures, and what has happened to Exeter flats since, are in our July report.
For the longer view, including how the city compares with Devon on each property type, see our Exeter house prices page. Our Exeter planning news page tracks what is being built, which is the other half of the same question.
Sources
- UK House Price Index, Exeter, June 2026, HM Land Registry, published 19 August 2026, for the average price, annual and monthly change, the by-type splits, the index against January 2023 and the sales volumes.
- ONS local housing prices visualisation for Exeter for the same series presented for the district.
- UK House Price Index, Devon for the county, district and comparator figures used in the chart.
Have your say